Introducing the Table visualization
This post is a bit old and outdated.
Rechart has evolved in the meantime.
Please refer to the more recent posts from here
Rechart is a chart library, no doubt.
Having said that, we’re introducing a basic table within the library.
A table is a visual representation of a dataset.
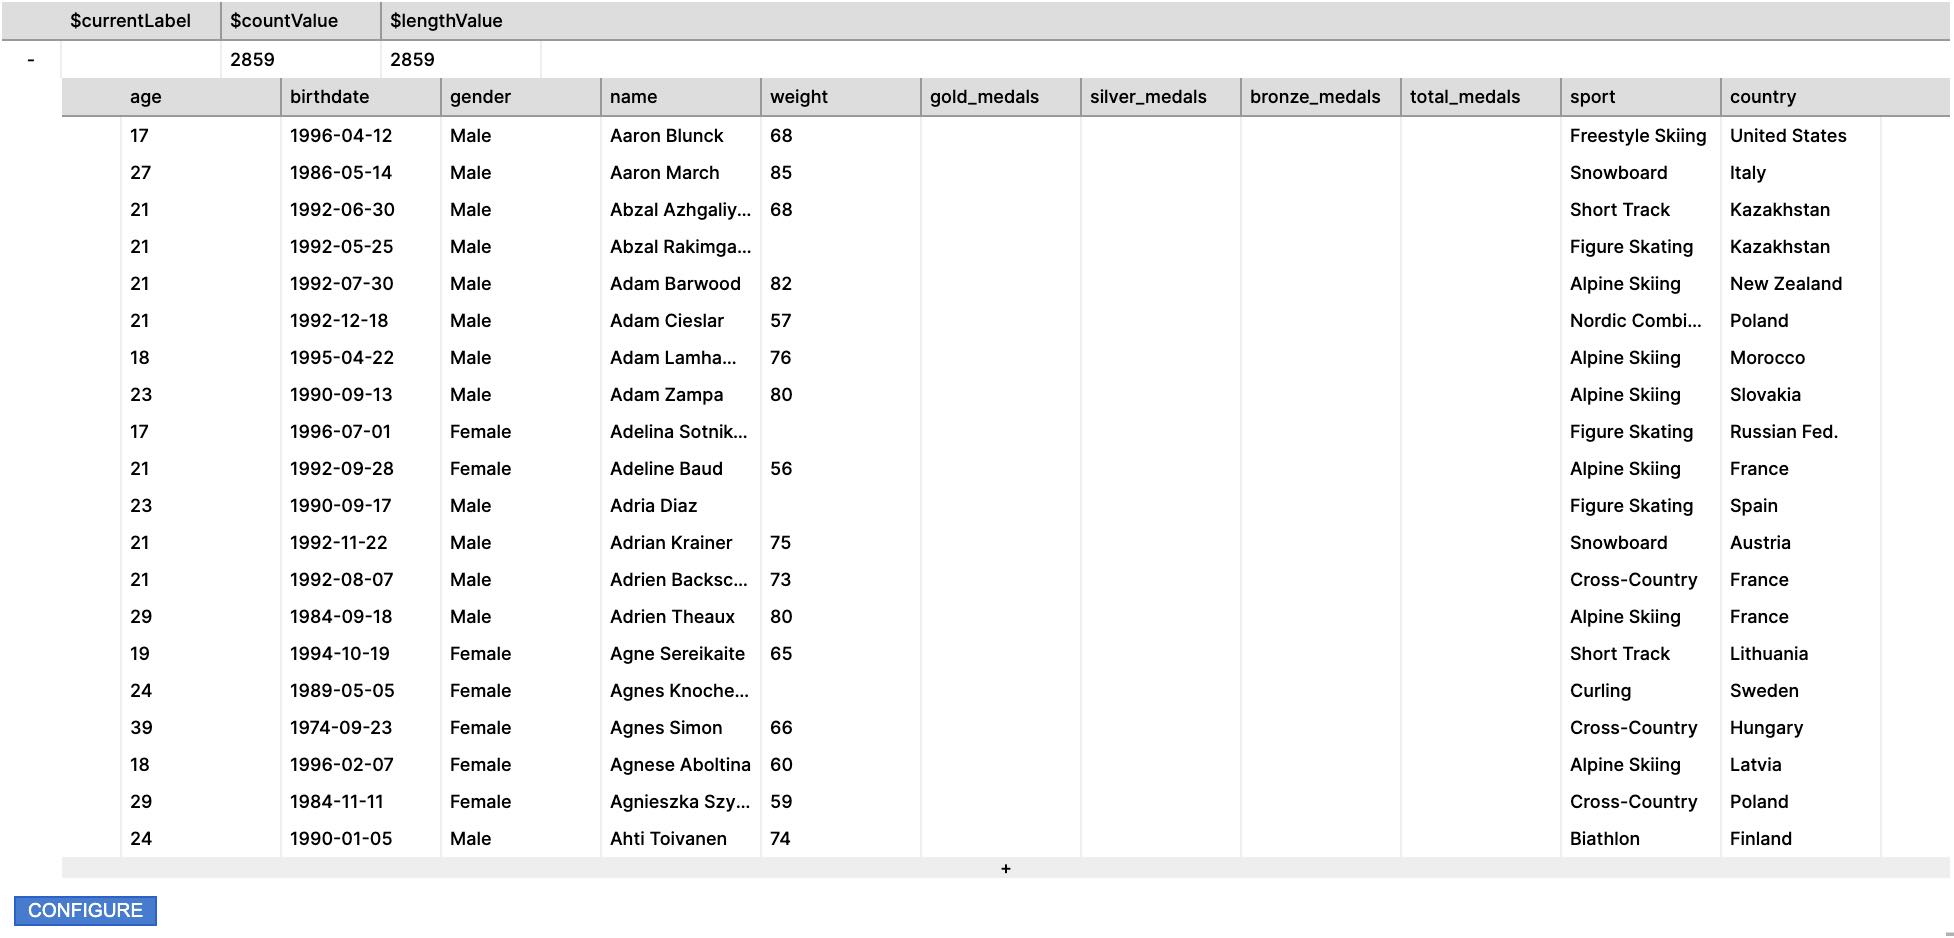
While it’s not very good on conveying patterns in data, it’s a great tool to understand the details of the data-points and it’s very good to help reasoning on the data during a preparation phase. This is why we’ve added it in Rechart.
The main purpose of the table is to give an easy tool to explore the dataset, its data-points and properties both before and during the data preparation activity.
It allows to navigare an hierarchycal dataset by expand/collapse each branch.
Each record shows all the properties it contains, both the native and the calculated one:
We believe it’s a great addition to the library. It’s currently in early stage with almost no options and customization possibilities. But it will improve over time, no doubt.