Rechart adds connected Charts in Retool
with an easy and visual configuration.
Turn your internal tools
into actionable dashboards and BI applications.
Rechart adds connected Charts in Retool
with an easy and visual configuration.
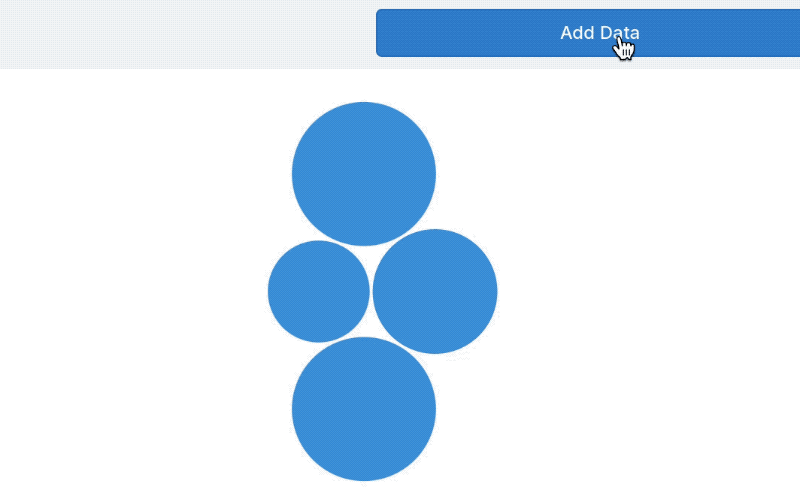
Rechart is a javascript library built to work nicely with Retool.
Every single chart option can be wired with a Retool component.
Furthermore, Rechart bring powerful interactive capabilities to enhance Retool apps.
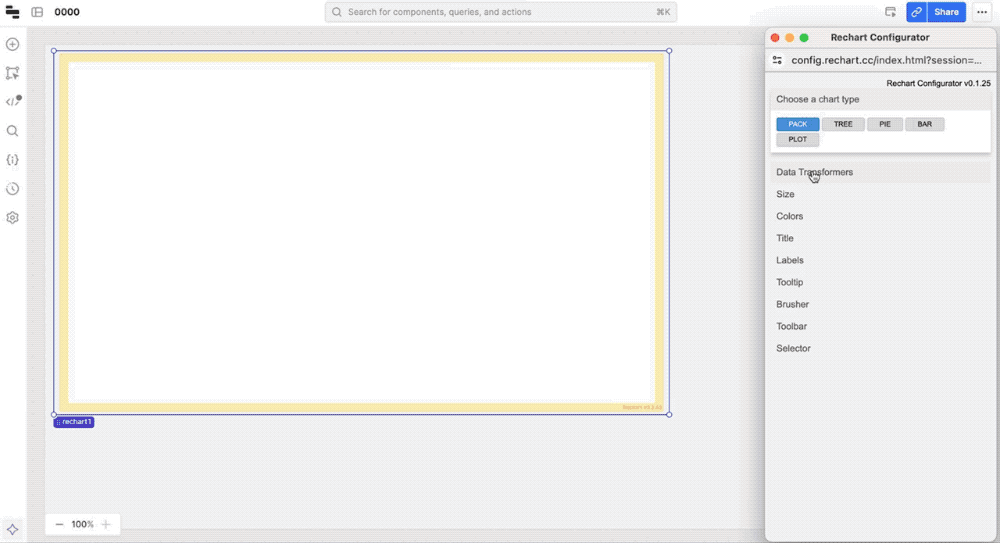
You don't have to mess with a JSON configuration. There's a visual configurator to configure a chart in seconds.
Furthermore, easy configuration doesn't mean simple charts. Rechart brings powerful chart and graph models.
At the core of the library there's a powerful interactivity system to bring actionable capabilities.
Showing data is the first step.
The second one is active exploration and investigation.
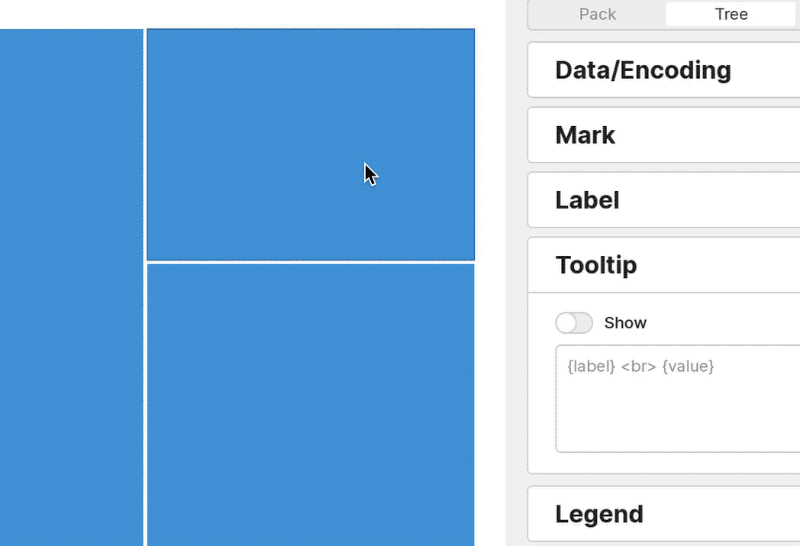
The tooltip is a powerful UI element that can bring great value to any data visualization.
Rechart allows to fully customize its content by using the data point properties and HTML/CSS as well.

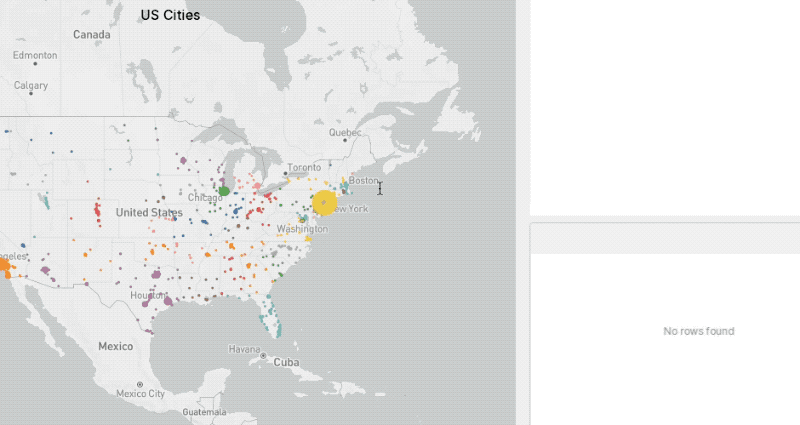
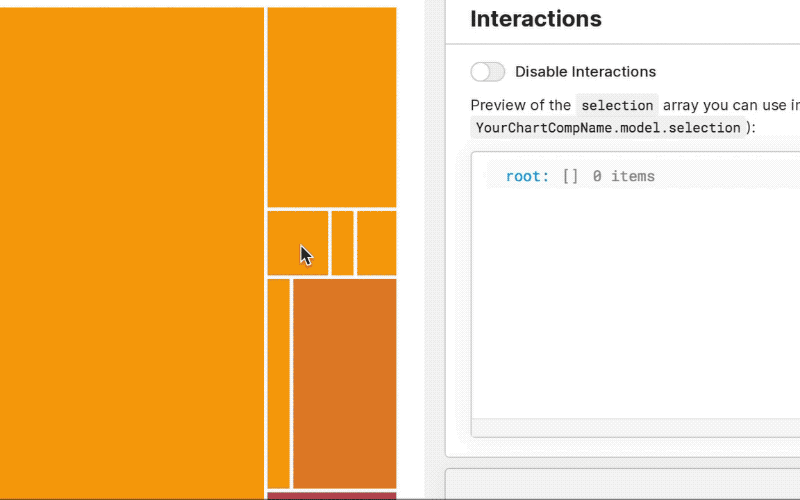
Select data points is key to start an investigation on a data corpus.
Rechart allows to select single o multiple data points in any charts by using both the point-click method and the brush tool as well.
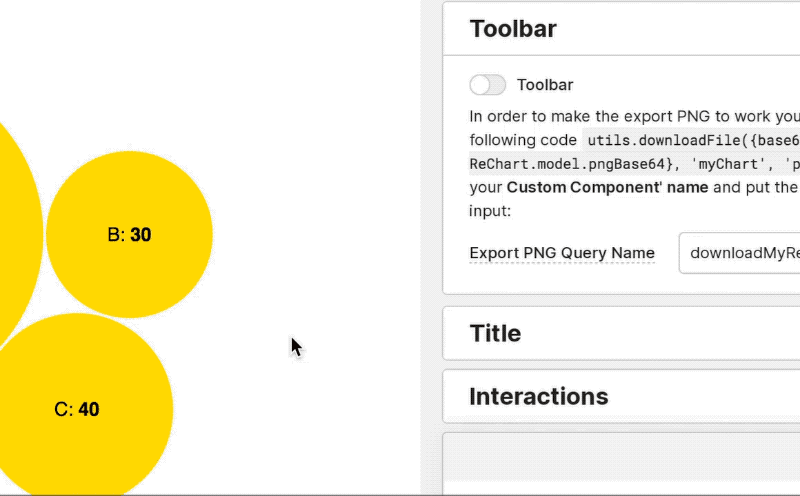
Saving the current state of a chart is great for internal communication.
Rechart allows to export any chart in the current state as PNG with minimal Retool integration.