Introducing Rechart
Hey! this is the first post here.
We’re pleased to introducing Rechart, a powerful javascript library that is able to turn Retool apps into actionable dashboards.
What is Retool
Retool is a powerful platform that allows to build internal tools fast.
It basically removes many complexities that belong to any software that needs to be developed (infrastructure, deployment, frontend, automation, maintenance, evolution, etc).
This is key in the field of internal tools where historically they are difficult to be mantained and evolved across the years and among the teams.
Any companies change over time, internal tools need to change with the same pace.
Furthermore, Retool enable more people of the organization to participate in that tools evolution.
Internal tools are (and will be more in the future) the backbone to fostering innovation and competitivity advantage.
Charts in Retool
Retool already contains a chart component, based on Plotly, that is good enough to add basic charts (barchart, piechart) in Retool, out of the box. Indeed, Rechart is not trying to be an alternative of Plotly.
Plotly relies on its own grammar to shape and configure charts. It’s a powerful grammar, that allows to create many different outputs. But this power comes with a cost. If you don’t know the grammar really well, you might have hard time playing with it. Even changing or adding simple stuff might become a configuration hell.
Welcome Rechart
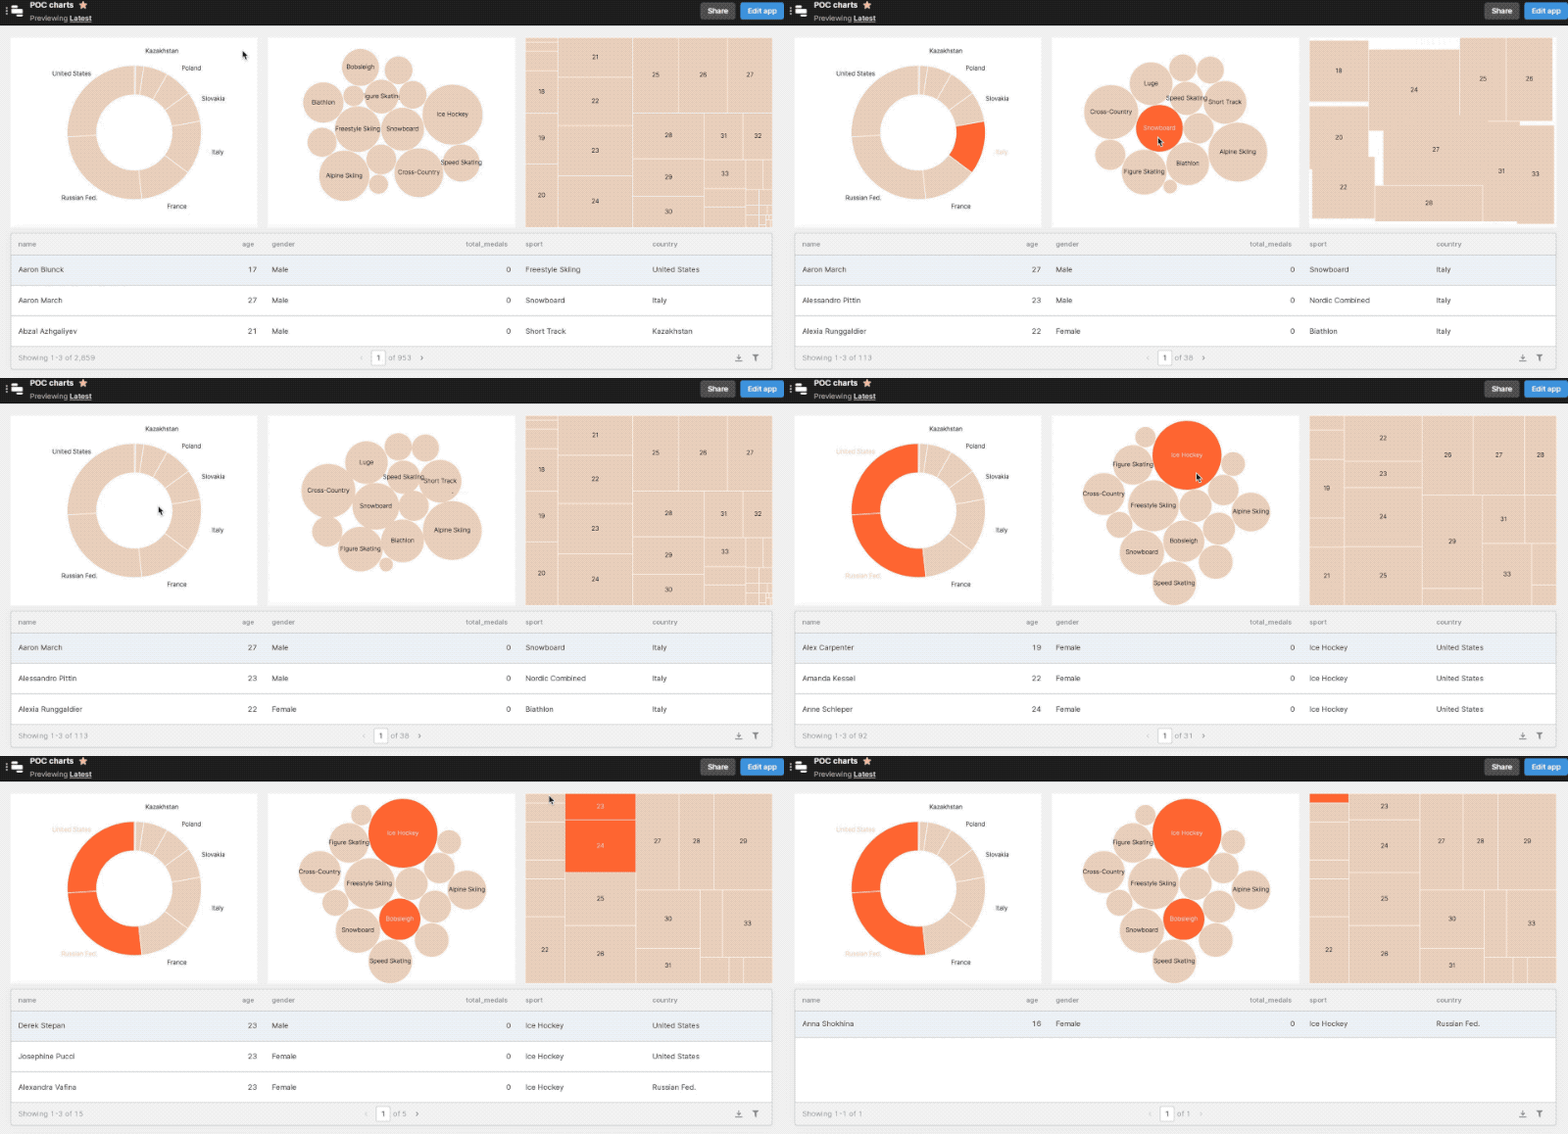
It’s all started with a simple proof-of-concept just to test the custom component capabilities of Retool:

The feedback from the community were interesting, thus, a journey started.
Rechart is not an alternative (even though it can be) of Plotly component. Its goal is to transform a Retool app into a powerful actionable dashboard, in order to let users explore interactively the data handled by a Retool app.
The main principles that are guiding the design and development are:
- Full Retool compatibility
- Easy configuration by using a visual configurator
- Actionability by design
We’re at the beginning of a journey, let’s see how it goes.
