Dynamic label size in Retool circle-pack chart
This post is a bit old and outdated.
Rechart has evolved in the meantime.
Please refer to the more recent posts from here
In this post you’ll learn how to set the label size dynamically according to the available space in a circle pack chart in Retool.
In Rechart making a circle-pack chart is dead-easy.
Let’s consider the Olympics’ athletes dataset and let’s suppose we’d like to represent each country in a circle-pack chart in Retool. The size of each circle should be calculate according to the number of athletes per country.
In Rechart configurator we need to Group-By the datum.country property and set as Size-By using any unique property, such as datum.name.
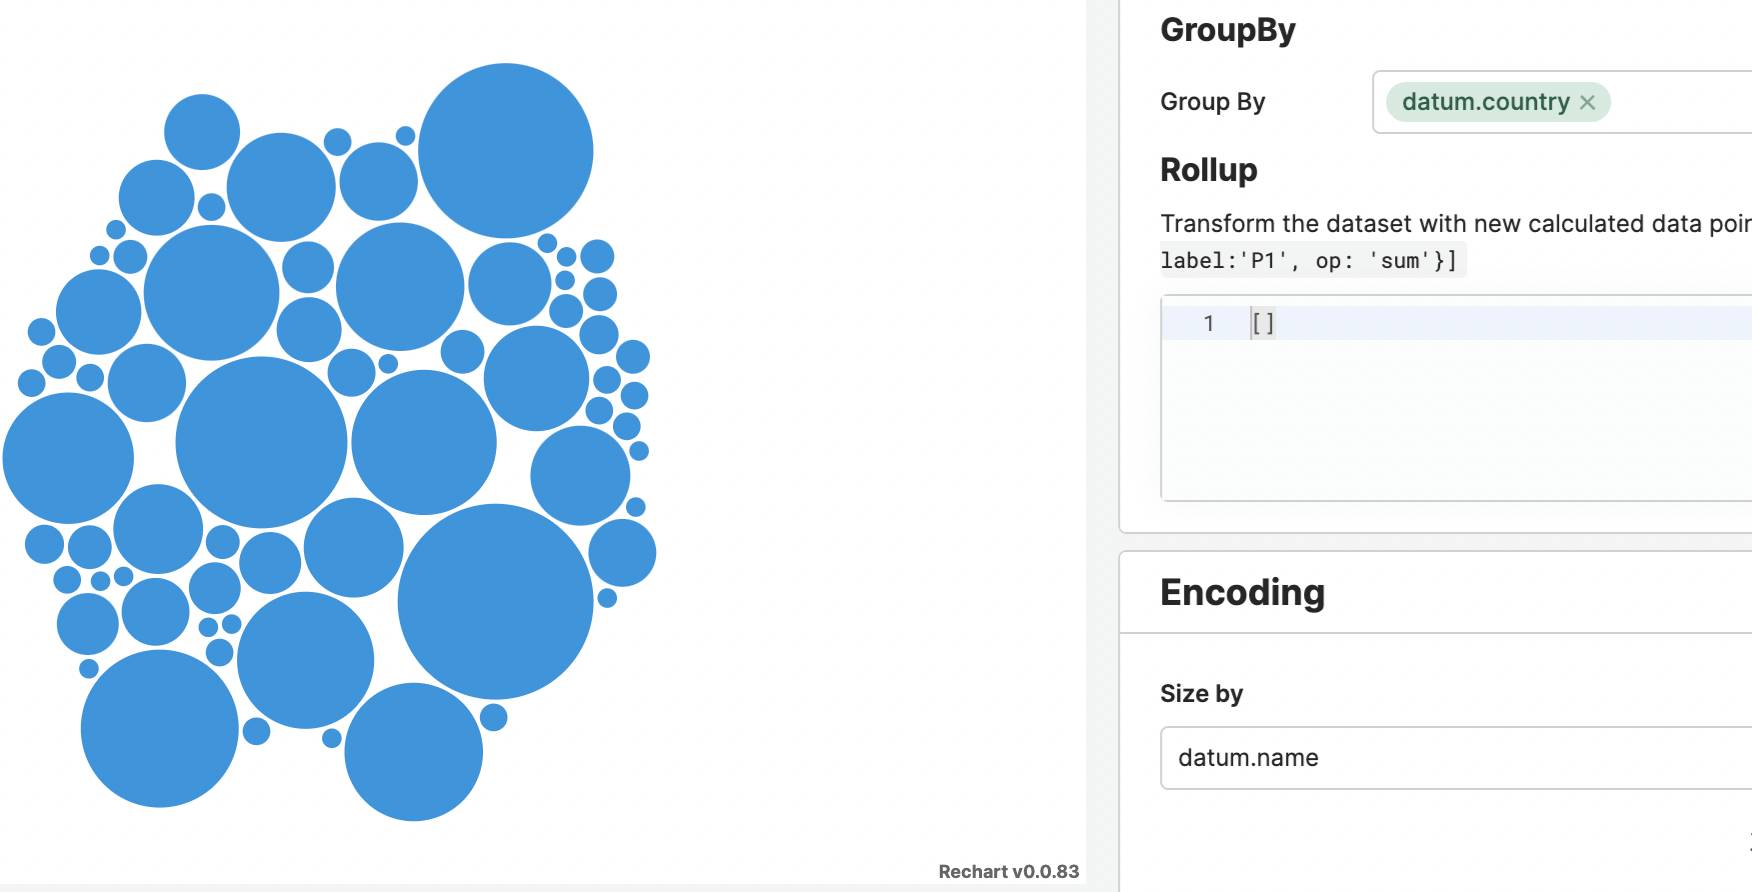
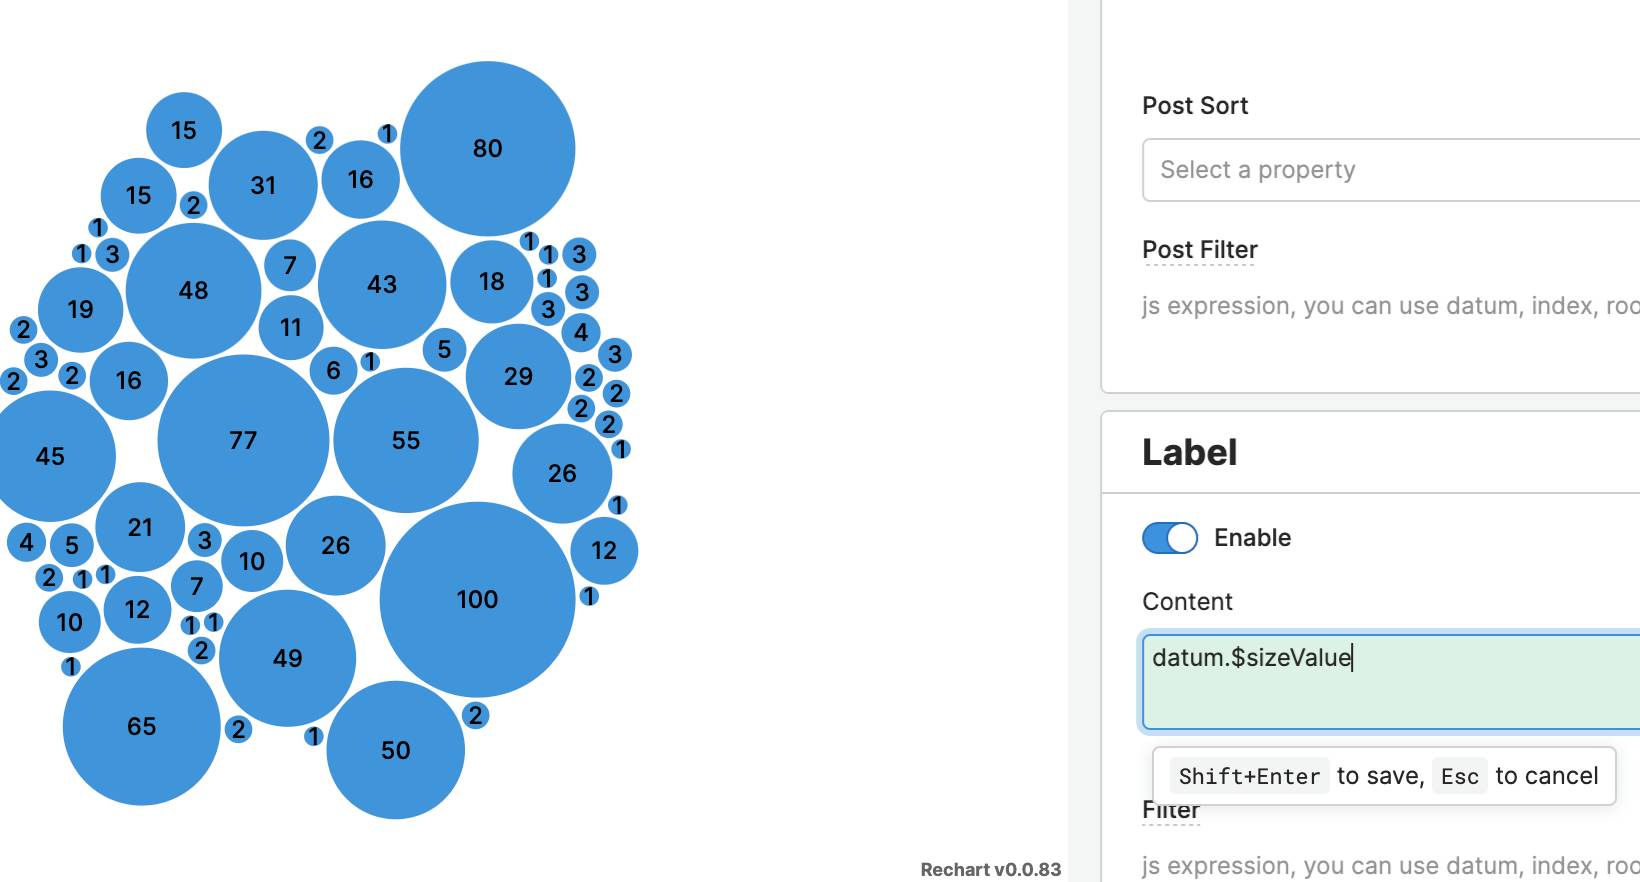
Next, we can enable the Labels section and specify the property we want to show as label, in this case datum.$sizeValue which is the calculated value during the aggregation.
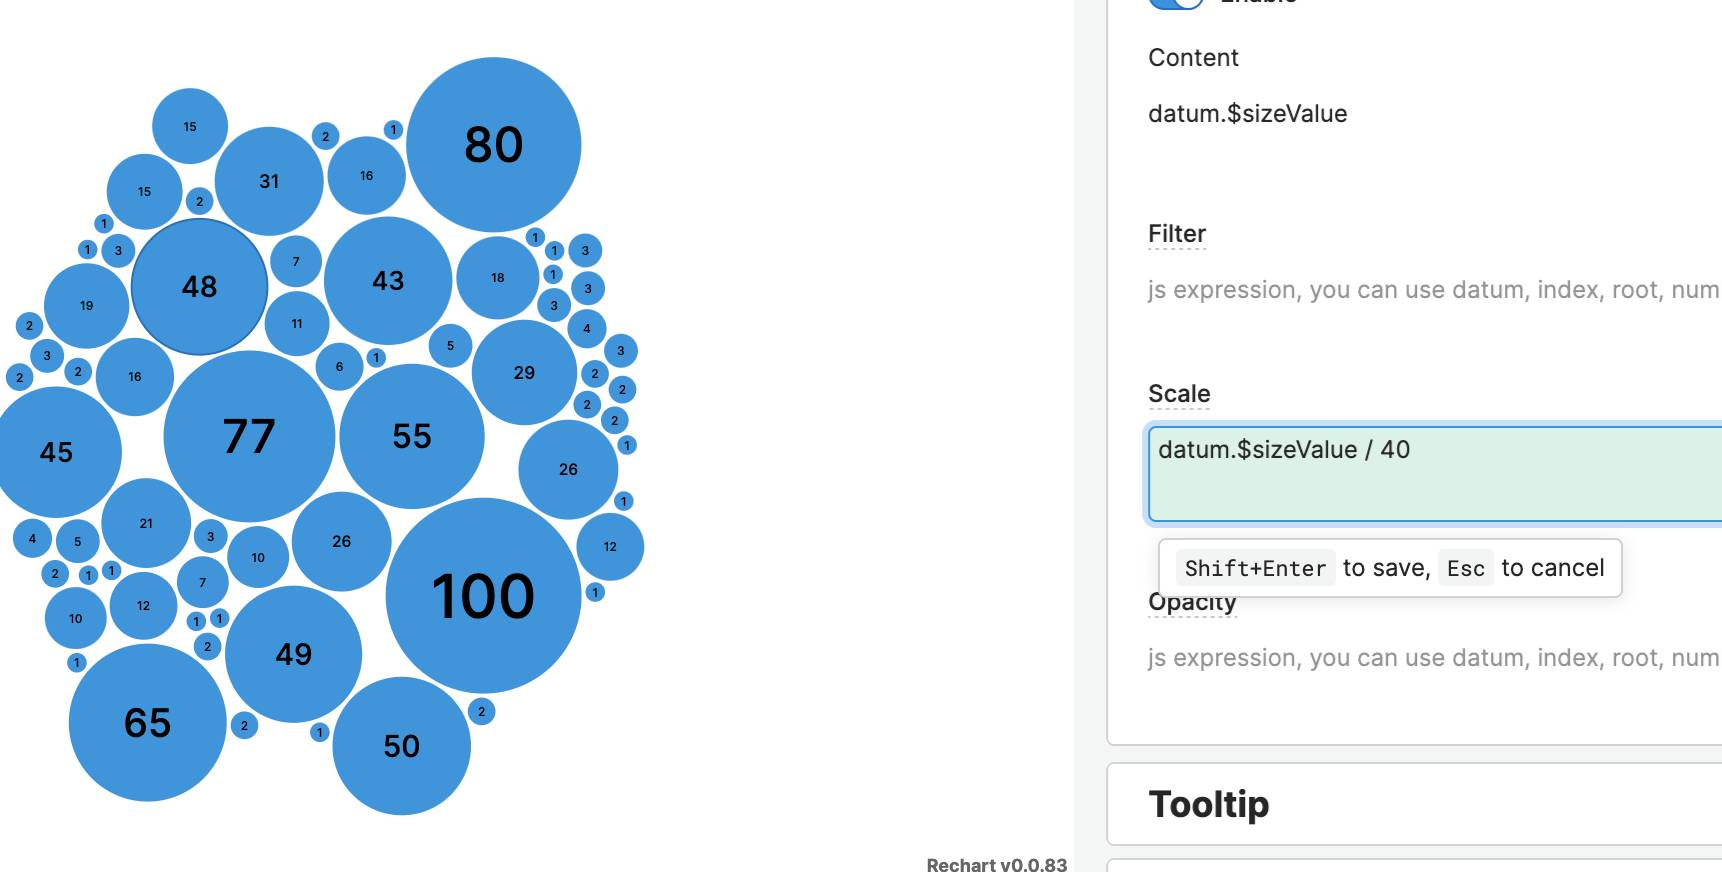
The next step is to change, in the Labels section, the size, and instead of using a fixed value, let’s calculate something dynamic with javascript, such as:
datum.$sizeValue / 40
The factor we used really depends of the dataset, because the size factor needs to be a number not too big, indeed, 1 is equivalent to 100% .
This is an example on how in Rechart is possible to customize many parts of the chart configuration by using little chunk of javascript.
Happy hacking!