Drill-down chart for hierarchical data in Retool
This post is a bit old and outdated.
Rechart has evolved in the meantime.
Please refer to the more recent posts from here
One of the main principles of Rechart is to let the users asking questions to data easily. Showing the big picture is an important step but going deeper to discover answers is also important as well.
This is even more important considering the general purpose of a Retool app that is meant to provide answers from data fast! I really don’t know if Plotly is able to do such drill-down functionality out of the box, but you don’t have to discover it!
If a dataset has a lot of values, the drill-down functionality allows to see one level at a time. This is useful when you want to show summary data in a report but also provide the option to drill into more detailed data.
Drilldowns are based on dataset that can be transformed as hierarchies.
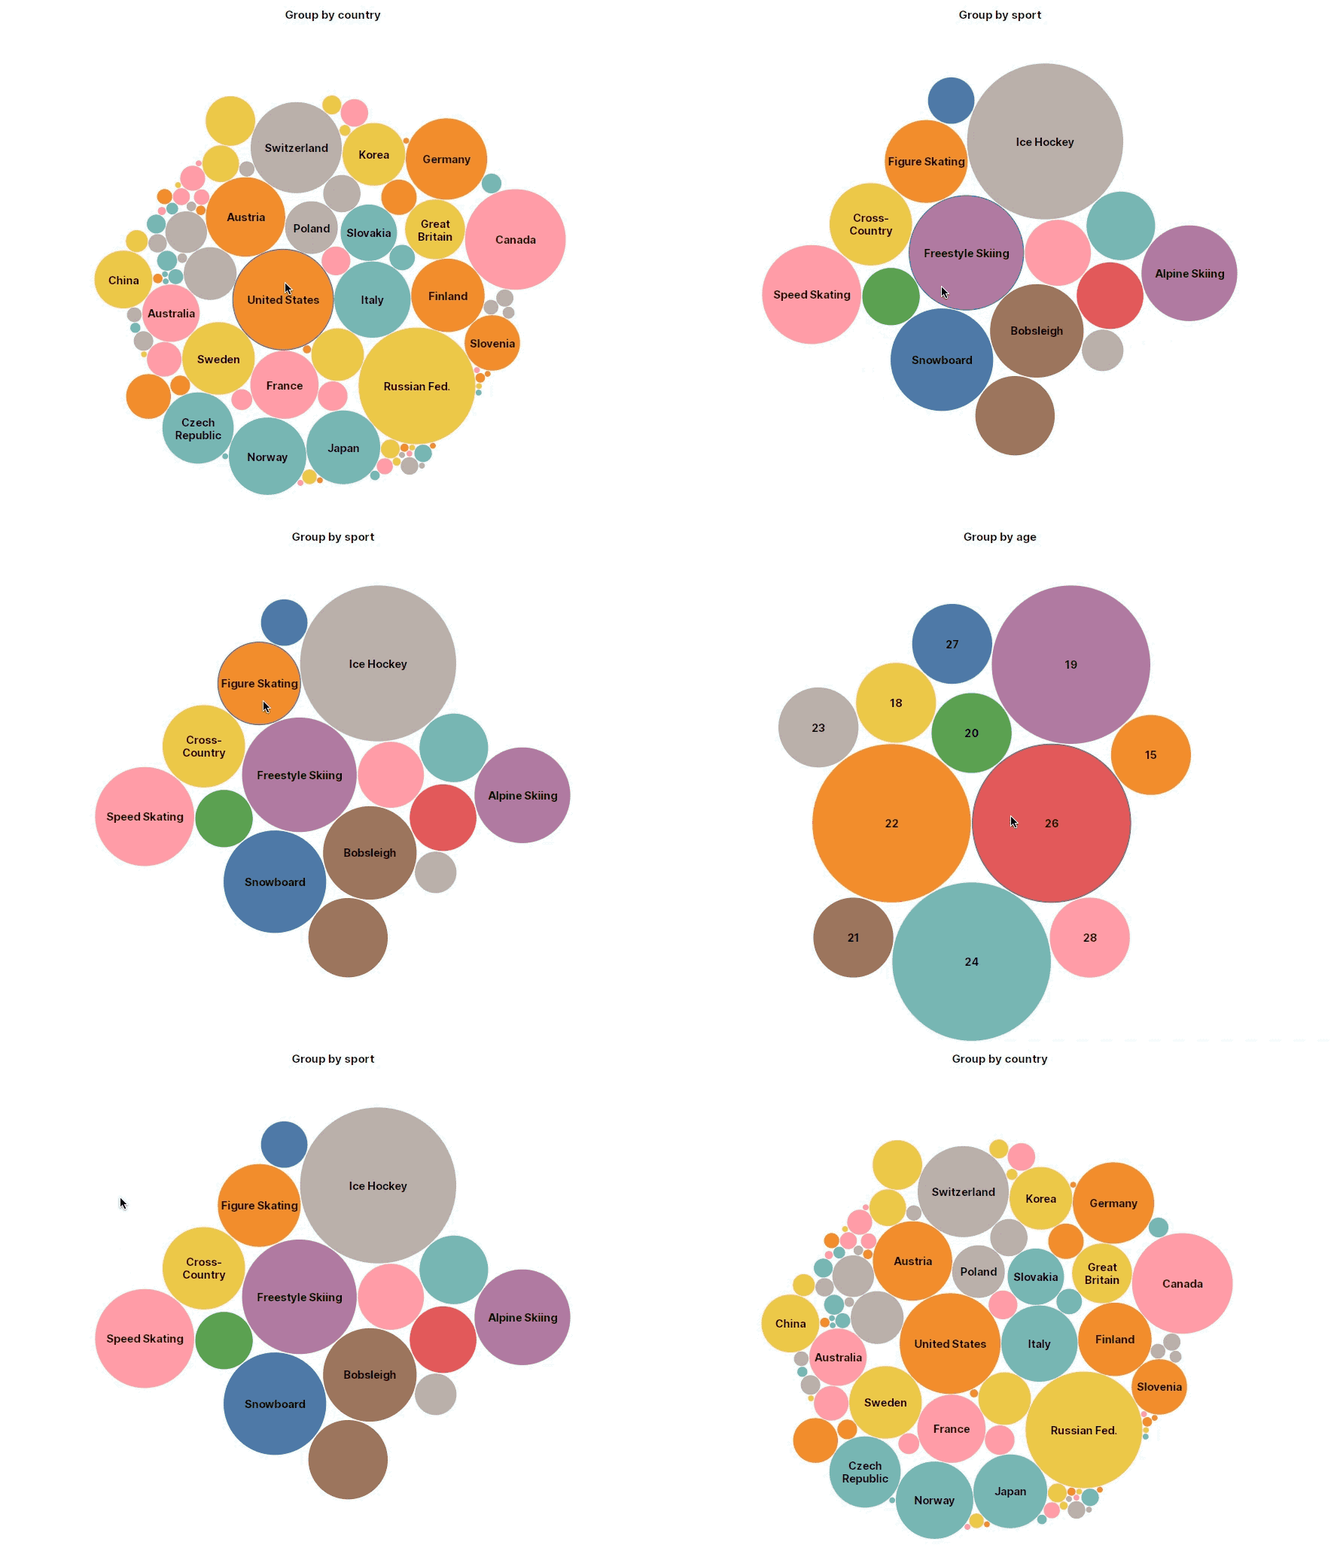
In Rechart you can group-by one or many properties easily. From now on, the dataset can be explored using the built-in drill-down capability, such as in this example:

The chart above is a circle packing chart that shows the olympic dataset, grouped by country, sport and age, in that order.
By double-clicking on a specific item the chart updates showing the nested aggregated representation using only the subset of data-points belonging to the selected item. For instance, by double-clicking to “United States” item, the user will see then the sport distribution of it. By continue to double-clicking to a sport item, such as “Figure Skating”, the user will see the age distribution of that sport item.
To get back to the parent group, just double-click on the canvas.
This is a built-in and automatic function present in any chart models in Rechart.
Interested in this capability? Let us know!
