Cross-Communication between charts in Retool
This post is a bit old and outdated.
Rechart has evolved in the meantime.
Please refer to the more recent posts from here
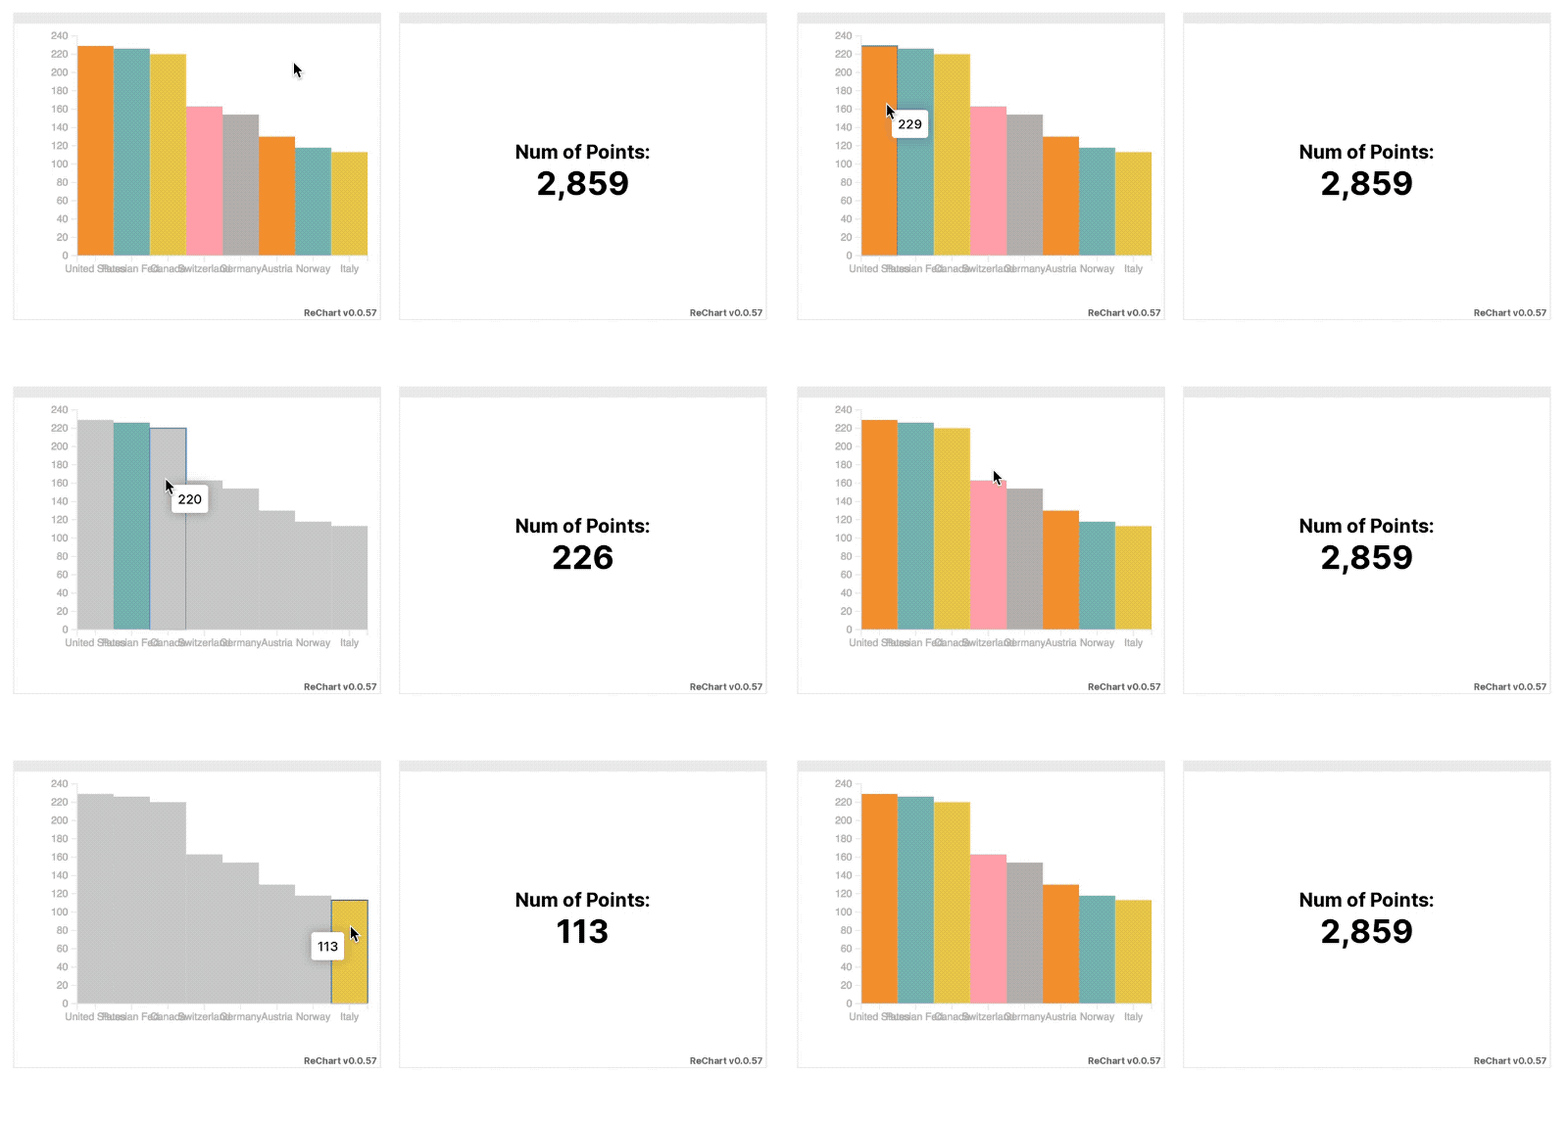
One of the main core feature of Rechart is its built-in capability to cross-communicate between different charts, pretty much Tableau does in its dashboard.
We’re proud of this feature because we do believe it brings great value on data exploration activities in dashboards.
In this screencast we’re showing the basic cross-communication between two charts in Retool. This is something not easily possible using the Plotly component. You can see the updates happen in real-time upon each user interaction:

We’re still pushing on this capability, we’ll make further updates on it. Stay tuned!
